U.S. Sports Betting Data: Market Share Stats By Brand, Gross Gaming Revenue, Parlay Handle, Hold
Here are regularly updated U.S. sports betting market charts, insights, and trends

7 min

Last updated: May 14, 2026 | Data current through latest March 2026 filings
I’ve been tracking the regulated U.S. sports betting market since New Jersey took the first post-PASPA wager in June 2018. Eight years later, the market has processed more than $600 billion in cumulative legal wagers and shows no signs of slowing. The data below tells the story of who’s winning, who’s losing, and where the money actually goes.
Our team of journalists and analysts maintains this live database, built on state agency filings, in collaboration with independent analyst Alfonso Straffon, a longtime industry observer, former sports trader, and equities analyst at Deutsche Bank. We update on or about the third Thursday each month. This month’s release reflects a two-month data catch-up, so you’re seeing figures through March 2026.
⚠️ Citation request: If you reference any data from this page, please support our work and cite this page with a link. Spotted an error? Reach out to brett@thirdplanet.us.
📊 1. Handle market share by operator (March 2022 to present)
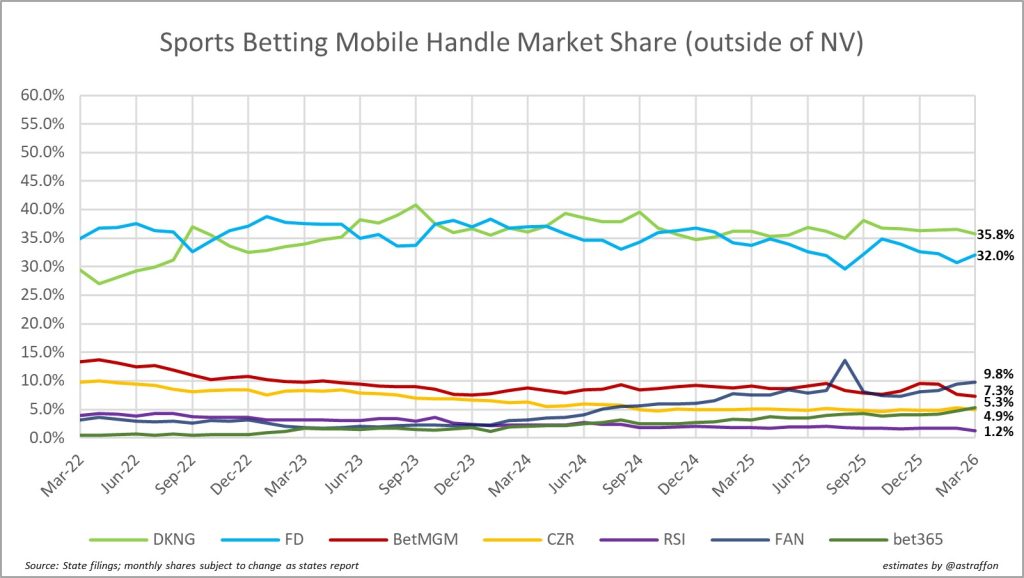
Key Insights:
- DraftKings reclaimed the handle crown from FanDuel in May 2025 and has held it since. As of March 2026, DraftKings leads with 35.8% to FanDuel’s 32.0%, a gap of 3.8 percentage points that has remained fairly static.
- The combined duopoly share currently sits at 67.8% of all dollars wagered in the regulated market, down from historical highs near 75%. The gap hasn’t been filled by a single challenger. It’s been distributed among BetMGM (9.8%), Fanatics (7.3%), and Caesars (5.3%).
- Fanatics’ August 2025 surge to 13% was likely inflated by promotional spending ahead of football season. By March 2026, it settled to 7.3%, still a meaningful improvement from where it started.
- theScore Bet (formerly ESPN Bet) shows at 1.2% share. PENN Entertainment exercised its opt-out clause in November 2025, shuttering ESPN Bet and relaunching as theScore Bet on December 1, coinciding with Missouri’s market opening. ESPN subsequently partnered with DraftKings for odds integration across its media properties.
📝 Context: The yellow spike for Caesars in early 2022 traces to a massive ad-and-bonus blitz timed to New York’s launch and the NFL playoffs. The momentum didn’t stick, but Caesars has held steady at 5-7% for both sports betting and the more lucrative iCasino sector.
💰 2. GGR market share by operator (March 2022 to present)
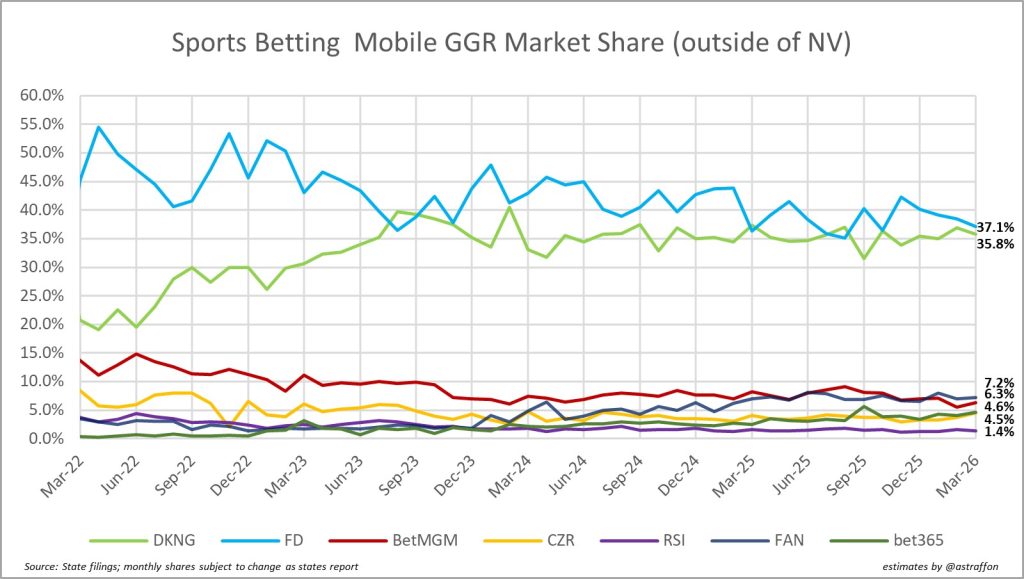
Key Insights:
- Revenue tells a different story than handle. FanDuel leads on GGR with 37.1% to DraftKings’ 35.8% as of March 2026. Winning the revenue battle while losing the handle battle comes down to one thing: hold percentage.
- FanDuel has historically carried a higher parlay mix (though this gap may have narrowed) and correspondingly higher hold. Flutter, FanDuel’s parent, has claimed superior pricing systems and a more effective parlay engine. The data at least doesn’t contradict them.
- BetMGM shows at 7.2% of GGR, slightly behind its 9.8% handle share, which means its hold percentage runs below the market average. Fanatics sits at 6.3%.
- Fanatics had been approaching 10% of the GGR pie in mid-2025 but slipped to the mid-6s. Still gunning for a podium position, and not far off.
🔑 Bottom Line: Hard Rock Bet, backed by the Seminole Tribe, will use its Florida monopoly position to drive national expansion, but Florida figures aren’t publicly reported. One more thing: the impact of prediction markets (Kalshi, Polymarket, plus DraftKings and FanDuel’s own vehicles) is not visible in these figures. Analyst estimates from early 2026 peg sports betting cannibalization at 0-5%.
📈 3. Handle by state, last twelve months (April 2025 through March 2026)
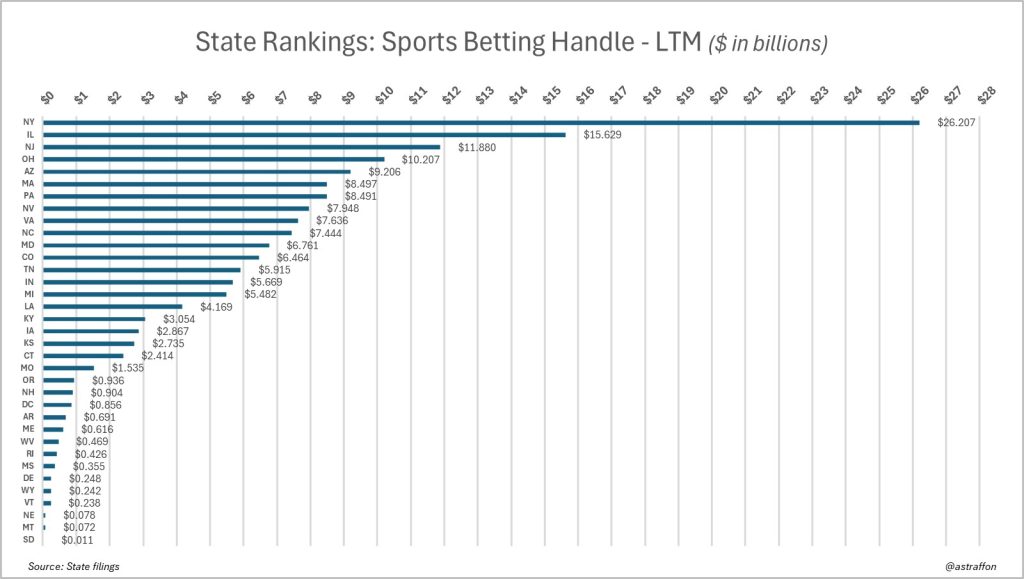
Key Insights:
- $26.2 billion wagered in New York over the trailing 12 months. The state’s nine regulated sportsbooks have averaged about $2.18 billion per month, more than the entire LTM total in most other states.
- That dominance isn’t surprising given New York’s population and per capita income, concentrated around New York City, Long Island, and Westchester County.
- Illinois at $15.6 billion has widened its lead over New Jersey ($11.9 billion) for the No. 2 spot, driven partly by the state’s aggressive market expansion and partly by New Jersey’s relative maturity.
- Oregon ($936 million) and New Hampshire ($904 million), where DraftKings holds a sportsbook monopoly in each, have both approached but fallen short of $1 billion annual handle.
Mississippi regulators and lawmakers have flirted with authorizing online sports betting repeatedly, most recently in January 2026, but it remains a casino-only state. If and when Texas and California join the regulated ranks (Las Vegas Sands is spending heavily to make it happen in Texas), the top of this chart will get interesting.
🏦 4. Gross revenue by state, LTM (April 2025 through March 2026)
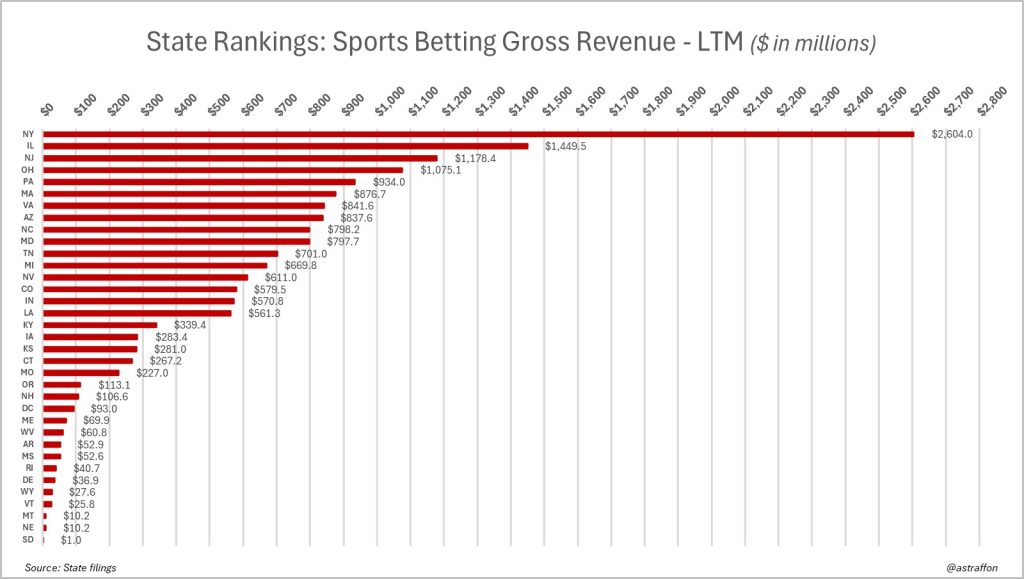
Key Insights:
- Operators collectively grossed $2.60 billion in New York over the LTM, but they also paid a $25 million up-front licensing fee and face a nation-leading 51% tax on GGR (tied with Rhode Island, and matched by Illinois and Vermont at the top brackets).
- Do not conflate gross revenue with net revenue or net profit. These are top-line figures before taxes, operating costs, and interest payments.
- North Carolina, which launched its online market in March 2024, has climbed past Michigan and into the top 10 with $798 million in GGR. Impressive for a market that’s just two years old.
- Illinois at $1.45 billion continues to be one of the most lucrative states, but the tax environment has turned hostile. More on that below.
⚠️ Illinois taxation: In June 2024, Gov. JB Pritzker signed a progressive tax scheme ranging from 20% to 40% of adjusted gross sports wagering receipts. Then in June 2025, the legislature added a per-wager tax: 25 cents on an operator’s first 20 million bets, 50 cents above that. FanDuel responded on June 10 with a 50-cent transaction fee on all Illinois wagers, effective September 1. Most other Illinois sportsbooks followed with per-bet fees or minimum bet requirements ($1 to $2). In the first three months, Illinois’ per-bet tax generated over $21 million in additional revenue, nearly $16.5 million of it from FanDuel and DraftKings alone. But total bets placed dropped by more than five million year-over-year in September 2025.
The Illinois progressive tax structure breaks down as follows:
| Annual AGSWR Bracket | Tax Rate |
|---|---|
| Up to $30 million | 20% |
| $30M to $50 million | 25% |
| $50M to $100 million | 30% |
| $100M to $200 million | 35% |
| Over $200 million | 40% |
The 40% rate hits only DraftKings and FanDuel, which was the intent. Other operators, barring a revenue surge, won’t reach the thresholds for higher brackets.
It got worse. In June 2025, the legislature passed a budget bill containing an additional per-wager tax: 25 cents for an operator’s first 20 million wagers, 50 cents for wagers above that. On June 10, FanDuel announced a 50-cent transaction fee on all Illinois wagers in response, effective September 1, saying it would drop the fee if lawmakers killed the per-bet tax. Most other Illinois sportsbooks followed with their own per-bet fees or minimum bet amounts of $1 to $2.
🏛️ 5. Tax revenue by state, LTM (April 2025 through March 2026)
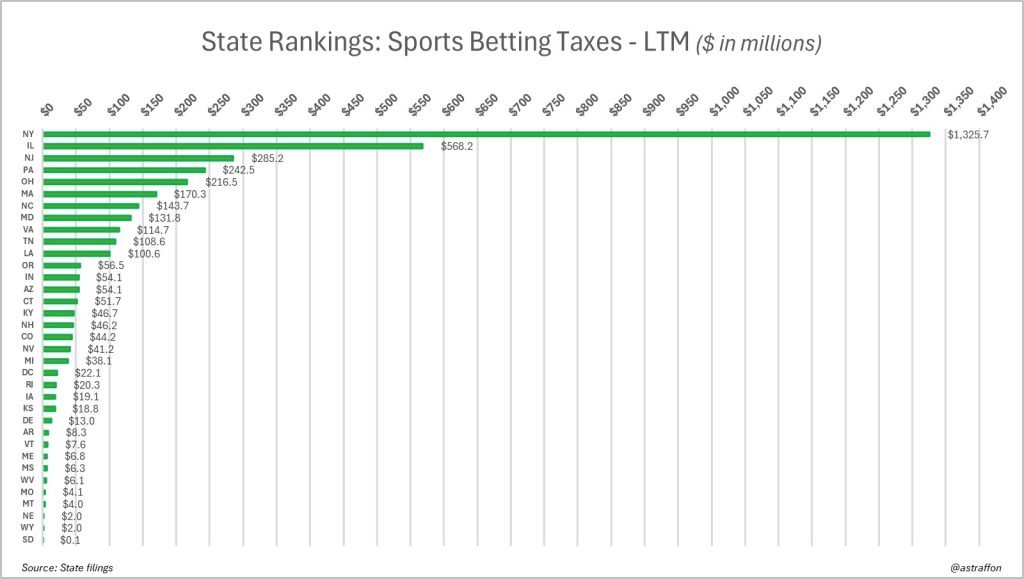
Key Insights:
- New York collected $1.33 billion in sports betting tax revenue over the LTM, a staggering haul that exceeds what most states generate from their entire gaming sectors.
- Illinois has jumped to second at $568 million, and the full impact of its new per-bet tax won’t be reflected until a full 12-month cycle is available. The gap with New York will narrow further throughout 2026.
- Ohio doubled its rate from 10% to 20% in June 2023, which is why it sits at $216 million instead of roughly half that. Lawmakers contemplated raising it again but backed off.
- Pennsylvania’s 36% rate, established at legalization, has generated $242 million over the LTM. Super Bowl LIX, in which the Eagles routed the Chiefs, was not a great outcome for the house in PA.
📝 Tax rate changes in 2025: Illinois’ shift to a progressive structure inspired a wave of increases across the country. Here’s where things landed:
- New Jersey: Rate increased from 13% (sports) and 15% (iGaming) to 19.75% for both. Gov. Murphy had pushed for 25%.
- Maryland: Rate rose from 15% to 20% under Gov. Moore’s budget. He’d initially sought 32%.
- Louisiana: Gov. Landry signed a hike from 15% to 21.5%, effective August 1, 2025. Revenue funds a new college athletics (SPORT) fund.
- North Carolina: The Senate proposed doubling the rate from 18% to 36%, but the final budget passed without the increase. Rate remains 18%. Could resurface in 2026.
- Indiana and Ohio considered similar proposals. Ohio’s was dropped from budget negotiations.
- Pennsylvania explored changes in November 2025 but backed off.
2024 background for posterity: DraftKings, during its Q3 2024 earnings, floated a plan to pass Illinois’ elevated tax back to bettors as a surcharge on winning bets. The reaction was brutal. FanDuel (Flutter) said during its own earnings call two weeks later that it absolutely would not follow DraftKings’ lead. DraftKings abandoned the idea, though CEO Jason Robins has said the company will consider any and all ideas to protect margins.
🎰 6. Parlay hold % versus non-parlay hold (March 2022 to present)
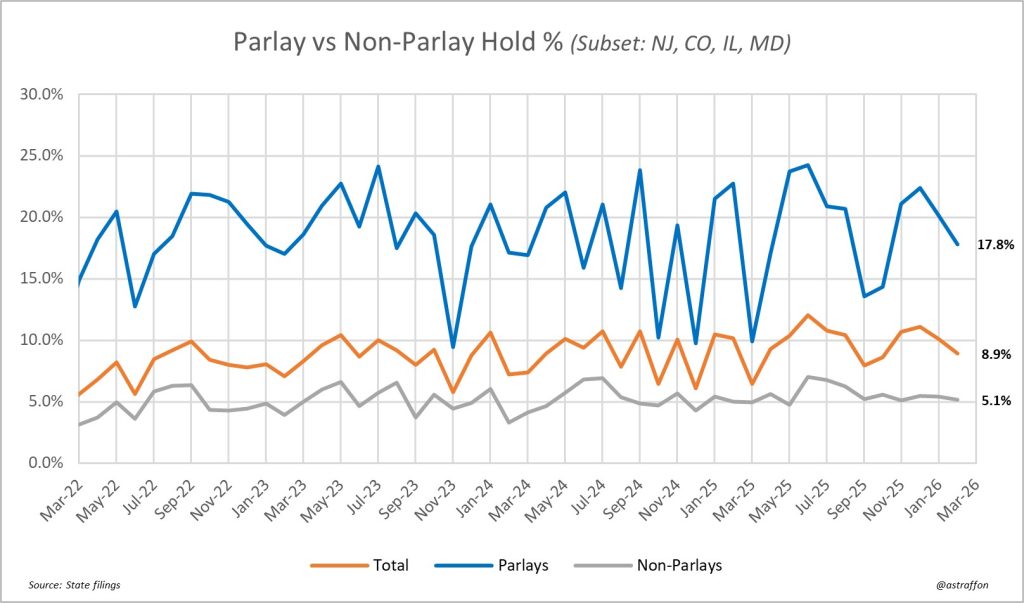
Key Insights:
- Month-to-month volatility is significant, but the long-term trend for hold percentage at U.S. sportsbooks points upward. Multiple forces are at work: growing customer adoption of Same Game Parlays (SGPs), improvements in operator pricing algorithms, and aggressive product emphasis on higher-margin offerings.
- This chart reflects betting activity in New Jersey, Colorado, Illinois, and Maryland only, though it’s a strong and representative sample given the overall volume in those states. Granular bet-type data reporting is better in some states than others.
- The parlay hold peaked at roughly 26% in November 2021 and again at 25.8% in June 2025, then sharply reversed both times. As of the latest data, parlay hold is at 17.8%, total hold at 8.9%, and non-parlay hold at 5.1%.
- Parlay and non-parlay hold percentages are generally correlated. When one rises or falls, the other tends to follow.
📊 7. Parlay revenue as a % of total revenue (March 2022 to present)
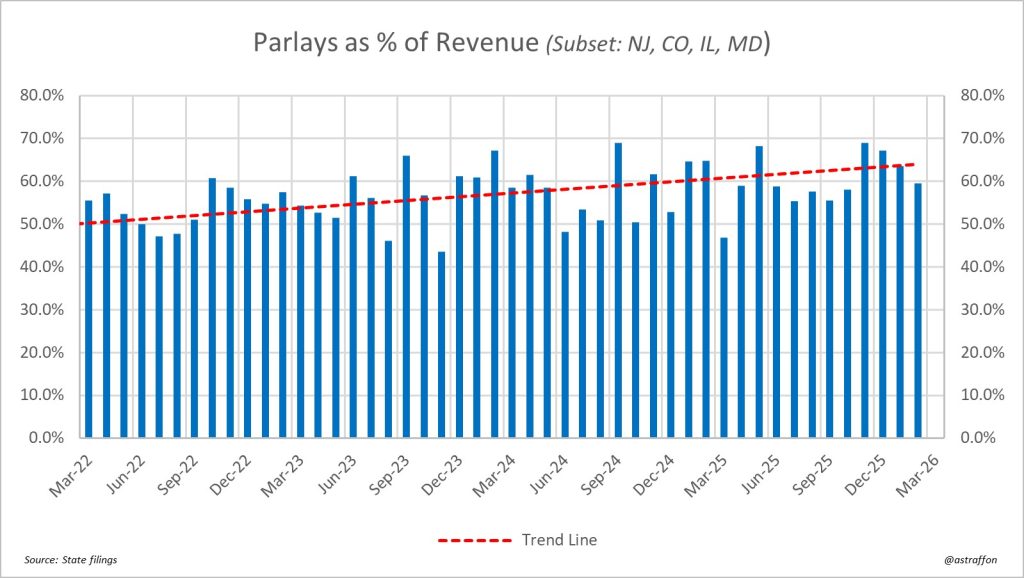
Key Insights:
- This line spiked near an all-time high at 69% in November 2025 and again in December, after a dip earlier in the football season. As of March 2026, it’s at 60%.
- The chalk-heavy NCAA tournament in March 2025 knocked parlay revenue below 50% of total operator revenue (47%), something that had only happened three other times since January 2023. It bounced back quickly.
- The trendline across the full four-year period is unmistakable. Parlays have gone from generating roughly half of operator revenue to routinely clearing 60%, with occasional surges near 70%.
- How high can this go? Probably limited only by product ingenuity on the operator side, tempered by the risk of burning out bankrolls too fast.
🎯 8. Parlay handle as % of total handle (March 2022 to present)
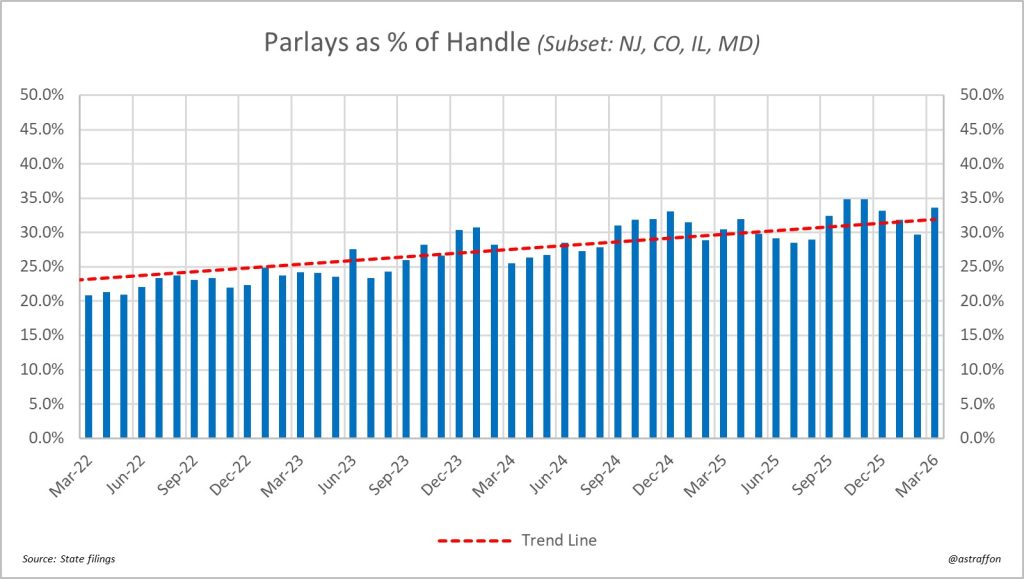
Key Insights:
- A new record arrived in January 2026: parlays hit 35.1% of overall handle, before settling to 31% in February and trending back toward 34% in March.
- Over four years, this figure has grown from about 20% of handle to routinely exceeding 30%. The trendline points clearly upward.
- The ceiling isn’t limitless. As long as VIPs continue placing large straight wagers on football and basketball spreads and totals, non-parlay volume will remain significant. But recreational bettors, who are the market’s growth engine, skew heavily toward parlays.
📉 9. National quarterly hold percentage (Q1 2021 to QTD 2026)
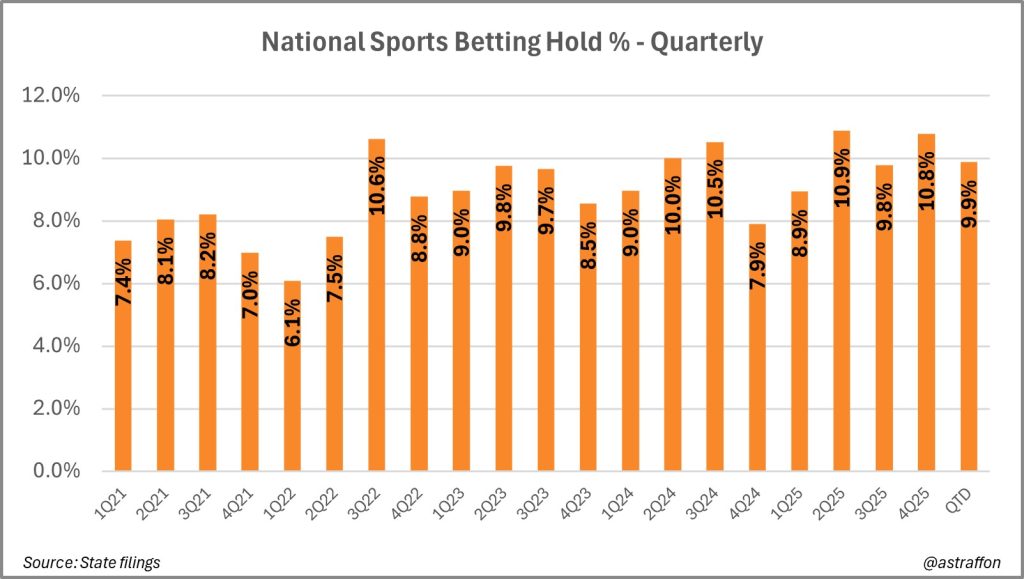
Key Insights:
- Q1 2026 (quarter-to-date through March) is tracking at 9.9%, solidly in the mid-to-high range established since Q3 2022.
- Q2 2025 at 10.9% represents the all-time high in our tracking. Q3 2025 initially trended above but settled back to 9.8% once September closed.
- Q4 2025 hit 10.8%, a strong finish. Compare that to Q4 2024’s 7.9%, which was dragged down by “customer-friendly” NFL results, meaning lots of favorites covering. Booking sports can be volatile, even in the era of parlays.
- The quarterly hold has hit or exceeded 10% six times now: Q3 2022 (10.6%), Q2 2024 (10.0%), Q3 2024 (10.5%), Q2 2025 (10.9%), Q3 2025 (9.8%), and Q4 2025 (10.8%). If you’re betting on where this number trends, the over on 10% for future quarters looks right.
- For perspective: pre-PASPA, when Nevada was the primary regulated market and parlays got far less emphasis, the national hold lived closer to 5%. The structural shift is real and probably permanent.
🔑 What’s next: Visit our companion database for U.S. Online Casino Data: Market Share By Brand, Gross Gaming Revenue Stats, and Taxation.
Selected data sources
- Illinois Gaming Board
- Michigan Gaming Control Board
- New Jersey Division of Gaming Enforcement
- New York State Gaming Commission
- Pennsylvania Gaming Control Board
Source: State filings. Charts and estimates by @astraffon. Monthly shares subject to revision as states report.