I've been tracking the regulated U.S. sports betting market since New Jersey took the first post-PASPA wager in June 2018. Eight years later, the market has processed more than $600 billion in cumulative legal wagers and shows no signs of slowing. The data below tells the story of who's winning, who's losing, and where the money actually goes.
Our team of journalists and analysts maintains this live database, built on state agency filings, in collaboration with independent analyst Alfonso Straffon, a longtime industry observer, former sports trader, and equities analyst at Deutsche Bank. We update on or about the third Thursday each month. You're seeing operator-level figures and state-level data through June 2026, which is the latest data available.
Citation request. If you reference any data from this page, please support our work and cite this page with a link. Spotted an error? Reach out to brett@thirdplanet.us.
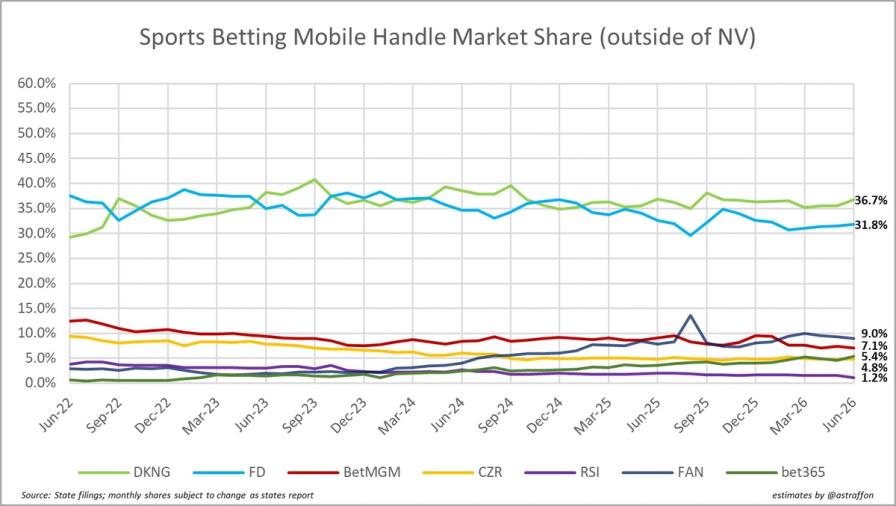
1. Handle market share by operator (March 2022 to present)
Key Insights:
- DraftKings reclaimed the handle crown from FanDuel in May 2025 and has widened the gap since. As of the latest data, DraftKings leads with 36.7% to FanDuel's 31.8%, a spread of nearly 5 percentage points, up from 3.6 points two months ago. DraftKings is pulling away on volume.
- The combined duopoly share currently sits at 68.5% of all dollars wagered in the regulated market, down from historical highs near 75%. The gap hasn't been filled by a single challenger. It's been distributed among BetMGM (9.0%), Fanatics (7.1%), bet365 (5.4%), and Caesars (4.8%).
- bet365 has cemented its position ahead of Caesars as the fifth-largest operator by handle share. The UK-based giant entered the U.S. market in New Jersey in 2019, expanded slowly, and now consistently processes more dollars than Caesars.
- Fanatics' August 2025 surge to 13% was likely inflated by promotional spending ahead of football season. It settled to the 7% range and has stayed there, still a meaningful improvement from where Fanatics started.
- theScore Bet (formerly ESPN Bet) no longer appears in the tracked operator set. PENN Entertainment exercised its opt-out clause in November 2025, shuttering ESPN Bet and relaunching as theScore Bet on December 1, coinciding with Missouri's market opening. ESPN subsequently partnered with DraftKings for odds integration across its media properties. Rush Street Interactive (BetRivers) now shows as the smallest tracked operator at 1.2% handle share.
Note: The yellow spike for Caesars in early 2022 traces to a massive ad-and-bonus blitz timed to New York's launch and the NFL playoffs. The momentum didn't stick, but Caesars has held steady in the 5-7% range for both sports betting and the more lucrative iCasino sector. With bet365 now clearly ahead on handle, Caesars' grip on that tier has loosened.
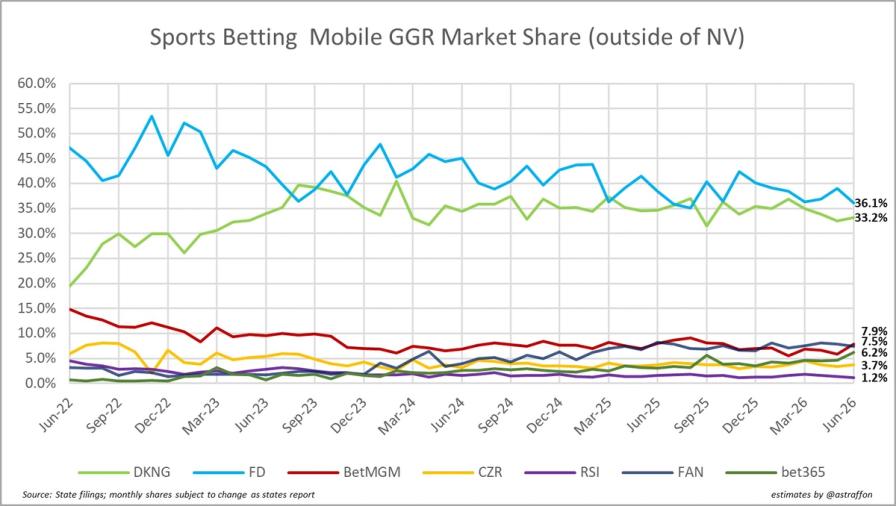
2. GGR market share by operator (March 2022 to present)
Key Insights:
- Revenue tells a different story than handle, but the gap is narrowing. FanDuel leads on GGR with 36.1% to DraftKings' 33.2%, a spread of 2.9 percentage points. That's a meaningful compression from the 3.5-point gap in our April data. DraftKings is still winning the volume battle and losing the margin battle, but the margin battle is getting closer.
- BetMGM has climbed to 7.9% of GGR, a notable recovery. It had slipped below 7% earlier in the year and appears to be stabilizing closer to a top-three position.
- bet365 has surged to 7.5% of GGR, nearly pulling even with BetMGM. That's a significant jump and positions bet365 as a legitimate third-tier competitor rather than a niche player.
- Fanatics has dropped to 3.7% of GGR despite holding 7.1% of handle. The math is stark: Fanatics is generating substantial betting volume but converting very little of it into revenue, implying either aggressive pricing, heavy promotional offsets, or unfavorable results. The 8.1% GGR share we reported in April appears to have been a high-water mark rather than a new baseline.
- Caesars sits at 6.2% of GGR, ahead of Fanatics but behind both BetMGM and bet365.
Also note: Hard Rock Bet, backed by the Seminole Tribe, will use its Florida monopoly position to drive national expansion, but Florida figures aren't publicly reported. One more thing: the impact of prediction markets (Kalshi, Polymarket, plus DraftKings and FanDuel's own vehicles) is not visible in these figures. Analyst estimates from early 2026 peg sports betting cannibalization at 0-5%.
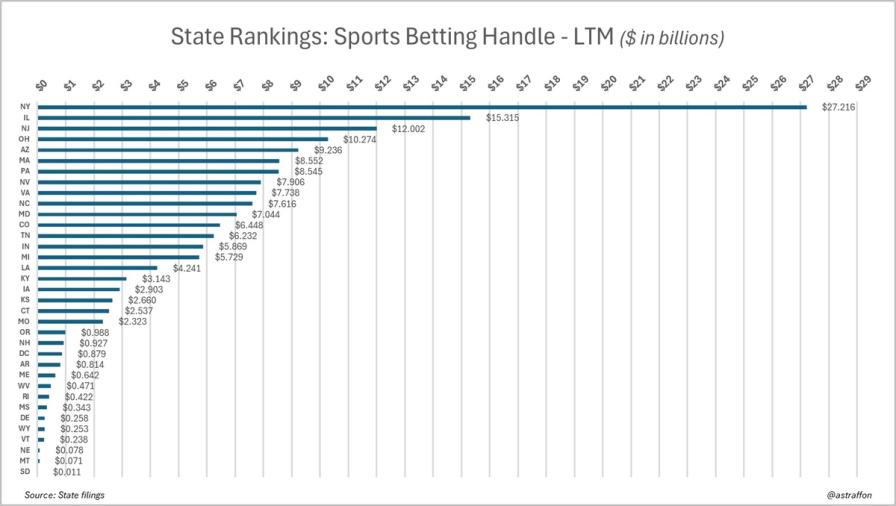
3. Handle by state, last twelve months (July 2025 through June 2026)
Key Insights:
- $27.2 billion wagered in New York over the trailing 12 months. The state's nine regulated sportsbooks have averaged about $2.27 billion per month, more than the entire LTM total in most other states.
- That dominance isn't surprising given New York's population and per capita income, concentrated around New York City, Long Island, and Westchester County.
- Illinois at $15.3 billion has maintained its lead over New Jersey ($12.0 billion) for the No. 2 spot, driven partly by the state's aggressive market expansion and partly by New Jersey's relative maturity.
- Ohio ($10.3 billion) and Arizona ($9.2 billion) round out the top five. Both states have benefited from broad mobile access and large, sports-hungry populations.
- Massachusetts ($8.6 billion) and Pennsylvania ($8.5 billion) are virtually tied at six and seven, with Massachusetts edging ahead by a sliver despite being a much younger market.
- Missouri makes its first appearance on the rankings at $2.3 billion, a solid debut for a market that launched in December 2025.
Mississippi regulators and lawmakers have flirted with authorizing online sports betting repeatedly, most recently in January 2026, but it remains a casino-only state. If and when Texas and California join the regulated ranks (Las Vegas Sands is spending heavily to make it happen in Texas), the top of this chart will get interesting.
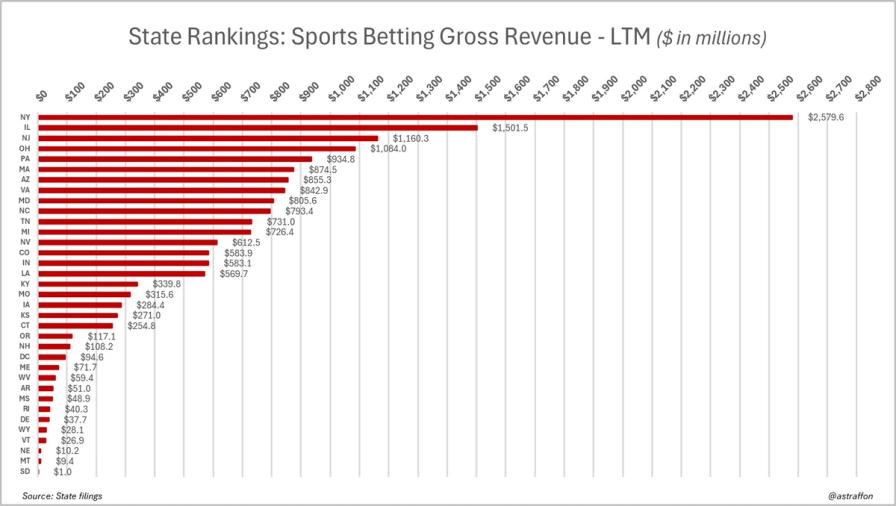
4. Gross revenue by state, LTM (July 2025 through June 2026)
Key Insights:
- Operators collectively grossed $2.58 billion in New York over the LTM, but they also paid a $25 million up-front licensing fee and face a nation-leading 51% tax on GGR (tied with Rhode Island, and matched by Illinois and Vermont at the top brackets).
- Do not conflate gross revenue with net revenue or net profit. These are top-line figures before taxes, operating costs, and interest payments.
- Illinois at $1.50 billion and New Jersey at $1.16 billion hold the second and third spots, each clearing the billion-dollar threshold alongside Ohio at $1.08 billion. That makes four states now in the billion-dollar GGR club.
- Pennsylvania ($934.8 million), Massachusetts ($874.5 million), and Arizona ($855.3 million) are bunched tightly in the next tier. Massachusetts' rapid ascent is notable for a market that only launched in early 2023.
- Missouri debuted at $315.6 million in GGR, already ahead of Iowa and Kansas in its first partial year on the rankings.
Illinois taxation. In June 2024, Gov. JB Pritzker signed a progressive tax scheme ranging from 20% to 40% of adjusted gross sports wagering receipts. Then in June 2025, the legislature added a per-wager tax: 25 cents on an operator's first 20 million bets, 50 cents above that. FanDuel responded on June 10 with a 50-cent transaction fee on all Illinois wagers, effective September 1. Most other Illinois sportsbooks followed with per-bet fees or minimum bet requirements ($1 to $2). In the first three months, Illinois' per-bet tax generated over $21 million in additional revenue, nearly $16.5 million of it from FanDuel and DraftKings alone. But total bets placed dropped by more than five million year-over-year in September 2025.
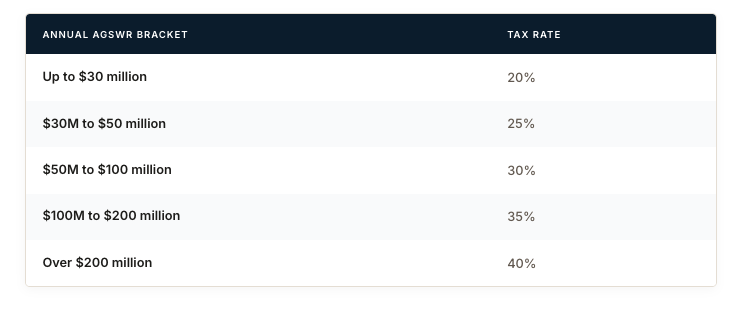
The 40% rate hits only DraftKings and FanDuel, which was the intent. Other operators, barring a revenue surge, won't reach the thresholds for higher brackets.
It got worse. In June 2025, the legislature passed a budget bill containing an additional per-wager tax: 25 cents for an operator's first 20 million wagers, 50 cents for wagers above that. On June 10, FanDuel announced a 50-cent transaction fee on all Illinois wagers in response, effective September 1, saying it would drop the fee if lawmakers killed the per-bet tax. Most other Illinois sportsbooks followed with their own per-bet fees or minimum bet amounts of $1 to $2.
5. Tax revenue by state, LTM (July 2025 through June 2026)
Key Insights:
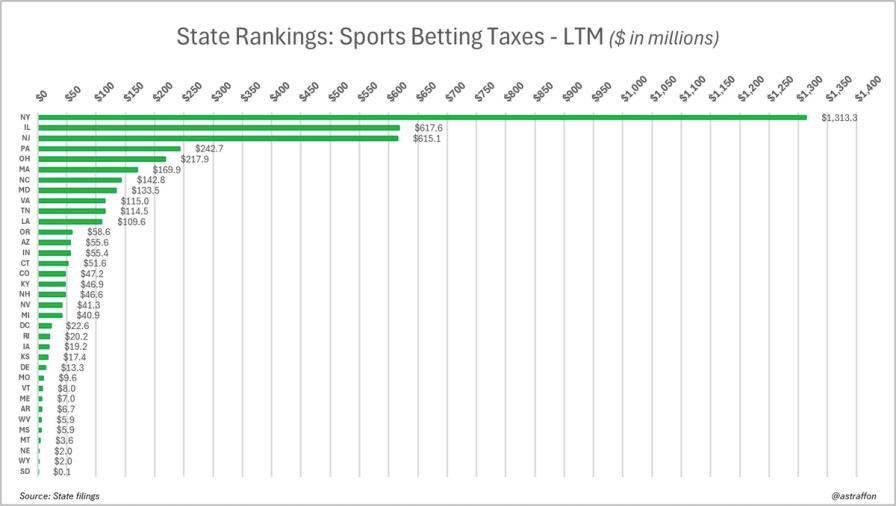
- New York collected $1.31 billion in sports betting tax revenue over the LTM, a staggering haul that exceeds what most states generate from their entire gaming sectors.
- The biggest shift in this update: New Jersey has vaulted from a distant third to a virtual tie with Illinois for the No. 2 spot. New Jersey generated $615.1 million in tax revenue against Illinois' $617.6 million. That's the full impact of New Jersey's rate hike from 13% to 19.75%, which took effect in 2025. To put it in context, New Jersey was collecting roughly $285 million over the prior LTM window at the old rate. The rate increase more than doubled the state's sports betting tax haul.
- Pennsylvania sits fourth at $242.7 million, followed by Ohio at $217.9 million. Ohio doubled its rate from 10% to 20% in June 2023; lawmakers contemplated raising it again but backed off.
- North Carolina ($142.8 million) and Maryland ($133.5 million) round out the top eight. North Carolina's position is impressive given how recently the online market launched.
- Pennsylvania's 36% rate, established at legalization, has generated $242.7 million over the LTM. Super Bowl LIX, in which the Eagles routed the Chiefs, was not a great outcome for the house in PA.
Tax rate changes in 2025. Illinois' shift to a progressive structure inspired a wave of increases across the country. Here's where things landed:
- New Jersey: Rate increased from 13% (sports) and 15% (iGaming) to 19.75% for both. Gov. Murphy had pushed for 25%. The impact is now fully visible in the data: New Jersey's tax revenue has more than doubled.
- Maryland: Rate rose from 15% to 20% under Gov. Moore's budget. He'd initially sought 32%.
- Louisiana: Gov. Landry signed a hike from 15% to 21.5%, effective August 1, 2025. Revenue funds a new college athletics (SPORT) fund.
- North Carolina: The Senate proposed doubling the rate from 18% to 36%, but the final budget passed without the increase. Rate remains 18%. Could resurface in 2026.
- Indiana and Ohio considered similar proposals. Ohio's was dropped from budget negotiations.
- Pennsylvania explored changes in November 2025 but backed off.
2024 background for posterity: DraftKings, during its Q3 2024 earnings, floated a plan to pass Illinois' elevated tax back to bettors as a surcharge on winning bets. The reaction was brutal. FanDuel (Flutter) said during its own earnings call two weeks later that it absolutely would not follow DraftKings' lead. DraftKings abandoned the idea, though CEO Jason Robins has said the company will consider any and all ideas to protect margins.
6. Parlay hold % versus non-parlay hold (March 2022 to present)
Key Insights:
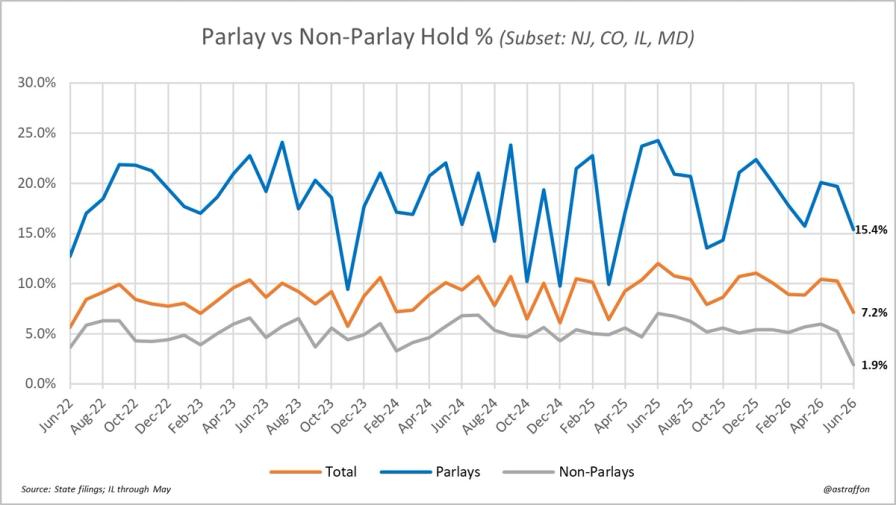
- Month-to-month volatility is significant, but the long-term trend for hold percentage at U.S. sportsbooks points upward. Multiple forces are at work: growing customer adoption of Same Game Parlays (SGPs), improvements in operator pricing algorithms, and aggressive product emphasis on higher-margin offerings.
- This chart reflects betting activity in New Jersey, Colorado, Illinois, and Maryland only, though it's a strong and representative sample given the overall volume in those states. Granular bet-type data reporting is better in some states than others.
- The latest monthly reading shows a sharp seasonal pullback: parlay hold dropped to 15.4%, total hold to 7.2%, and non-parlay hold to just 1.9%. That non-parlay figure is the lowest in our dataset and reflects the summer doldrums, when baseball dominates the calendar and betting volume thins out.
- Don't read too much into a single month. The parlay hold has peaked near 24% in prior cycles (mid-2023, mid-2025) and tends to recover heading into football season. The more telling signal is the long-term floor: even in the worst months, parlay hold hasn't dipped below roughly 12% since early 2022.
- Parlay and non-parlay hold percentages are generally correlated. When one rises or falls, the other tends to follow.
7. Parlay revenue as a % of total revenue (March 2022 to present)
Key Insights:
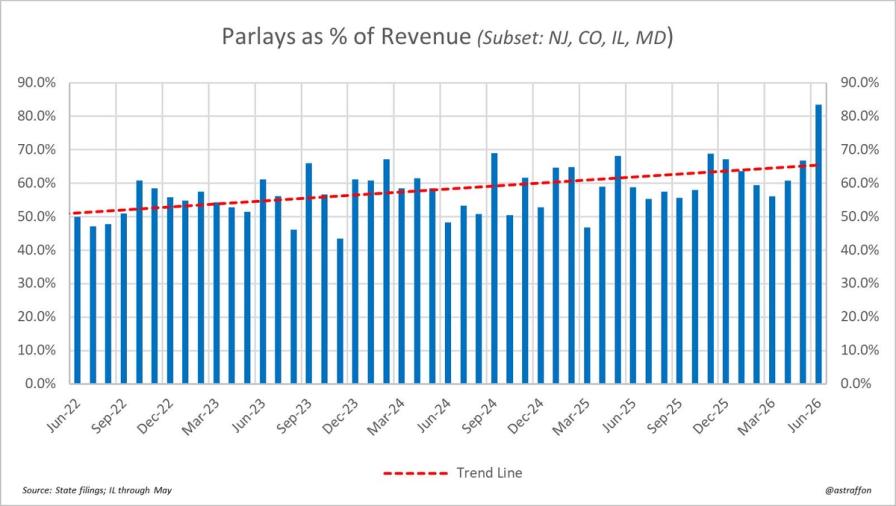
- Parlays as a share of operator revenue hit a new all-time high of approximately 84% in the most recent month, shattering the prior peak of 69% set in November 2025. Nearly three-quarters of all sportsbook revenue in the four-state sample now comes from parlay wagers.
- The chalk-heavy NCAA tournament in March 2025 knocked parlay revenue below 50% of total operator revenue (47%), something that had only happened three other times since January 2023. It bounced back quickly, and then some.
- The trendline across the full four-year period is pretty apparent. Parlays have gone from generating roughly half of operator revenue to routinely clearing 60%, with surges now pushing into the mid-70s.
- How high can this go? Probably limited only by product ingenuity on the operator side, tempered by the risk of burning out bankrolls too fast. The 74% reading suggests we may not be near the ceiling yet.
8. Parlay handle as % of total handle (March 2022 to present)
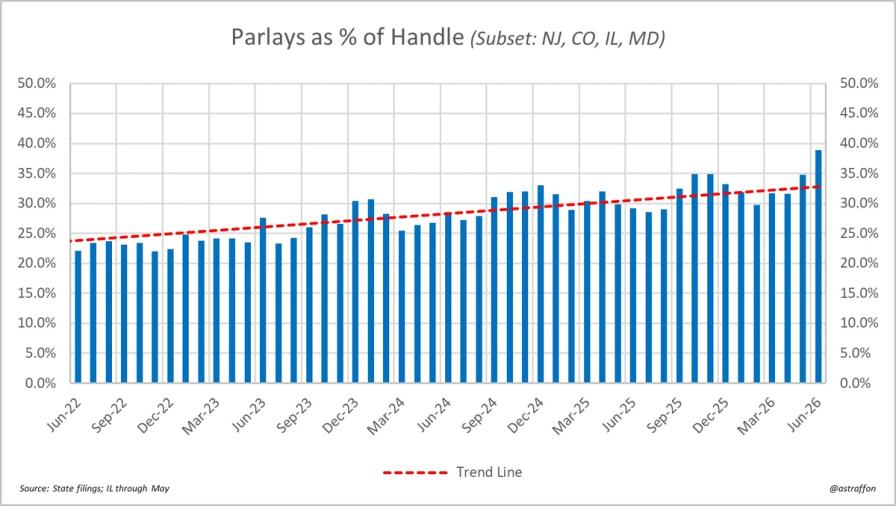
Key Insights:
- Parlays have set a new handle share record of approximately 39% in the latest month, eclipsing the prior high of 35.1% set in January 2026. Nearly four of every ten dollars wagered are now placed on parlay bets.
- Over four years, this figure has grown from about 20% of handle to approaching 40%. The trendline points clearly upward and shows no sign of plateauing.
- The ceiling isn't limitless. As long as VIPs continue placing large straight wagers on football and basketball spreads and totals, non-parlay volume will remain significant. But recreational bettors, who are the market's growth engine, skew heavily toward parlays, and their preferences are increasingly defining the market's shape.
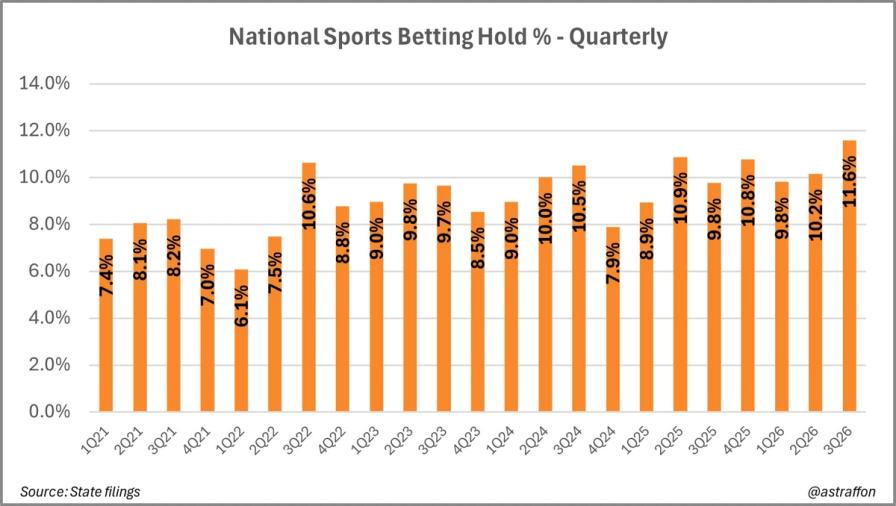
9. National quarterly hold percentage (Q1 2021 to QTD 2026)
Key Insights:
- Q2 2026 finalized at 10.2%, a solid print but a step back from the 11.2% pace we flagged in our last update. Late-quarter results moderated the figure.
- The real story is Q3 2026 (quarter-to-date), which is tracking at 11.6%, a new all-time high in our data. That surpasses the previous record of 10.9% set in Q2 2025 by a wide margin. July is typically a strong month for the house as baseball bettors feed the parlay machine without major-sport variance to disrupt it. Whether 11.6% holds through September depends on early NFL results, but even with some regression, Q3 2026 should land comfortably above 10%.
- Q4 2025 hit 10.8%, a big finish. Compare that to Q4 2024's 7.9%, which was dragged down by "customer-friendly" NFL results, meaning lots of favorites covering. Booking sports can be volatile, even in the era of parlays.
- The quarterly hold has now hit or exceeded 10% six times on a finalized basis: Q3 2022 (10.6%), Q2 2024 (10.0%), Q3 2024 (10.5%), Q2 2025 (10.9%), Q4 2025 (10.8%), and Q2 2026 (10.2%). QTD Q3 2026 at 11.6% will very likely make it seven. If you're betting on where this number trends, the over on 10% for future quarters looks right.
- For perspective: pre-PASPA, when Nevada was the primary regulated market and parlays got far less emphasis, the national hold lived closer to 5%. The structural shift is real and probably permanent.
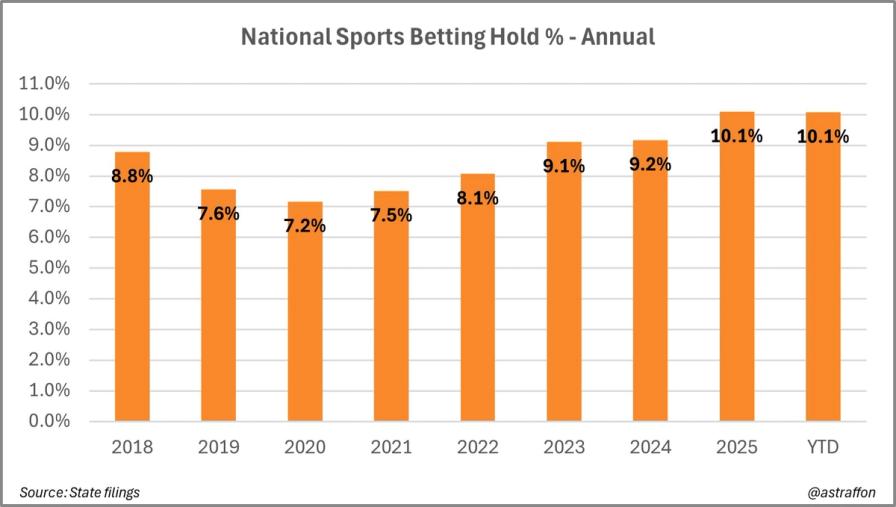
10. National annual hold percentage (2018 to YTD 2026)
Key Insights:
- 2025 was the first calendar year in which the national hold exceeded 10%. That's a milestone worth pausing on. The full-year print of 10.1% means operators kept more than a dime of every dollar wagered across the entire regulated market, on average, for 12 straight months.
- YTD 2026 is tracking at 10.1% as well, suggesting this isn't a one-year anomaly. The floor has moved.
- The annual view smooths out the quarterly noise and makes the long-term arc unmistakable: from 7.2% in 2020 (the trough, driven partly by COVID-era dynamics and a thinner parlay mix) to 10.1% today, a nearly 3-percentage-point climb in five years.
- The 2018 reading of 8.8% is an outlier in the other direction. With only a handful of states live and Nevada dominating the sample, that number reflects a different market entirely. The post-2020 trajectory is the one that matters for projecting forward.
- For bettors, the implication is stark: the house edge is structurally higher than it was when legal sports betting launched. Parlays, SGPs, and improved pricing algorithms have made the recreational bettor's dollar go shorter. We couldn't confirm whether any operator has publicly acknowledged this trend as a long-term strategic objective, but the data doesn't leave much room for alternative explanations.
What's next
Visit our companion database for U.S. Online Casino Data: Market Share By Brand, Gross Gaming Revenue Stats, and Taxation.
Selected data sources
- Illinois Gaming Board
- Michigan Gaming Control Board
- New Jersey Division of Gaming Enforcement
- New York State Gaming Commission
- Pennsylvania Gaming Control Board
Source: State filings. Charts and estimates by @astraffon. Monthly shares subject to revision as states report.